
Agency View Dashboard Guide
Welcome to the Signal House Dashboard in the GoHighLevel (GHL) App. This guide will walk you through the features and insights available in the Agency View to help you better manage your subaccounts and messaging performance across campaigns.
🎛 Dashboard Overview
Upon logging into the Signal House GHL App, you'll land on the Agency View Dashboard, which presents a comprehensive analytics snapshot across all your subaccounts.
This centralized view allows you to:
Monitor overall SMS/MMS activity
Understand delivery and opt-out rates
Track campaign statuses
Analyze trends and performance in real-time
➡️ Want to master dashboard navigation and learn pro tips? The article below makes it simple!
Dashboard Navigation 🧭
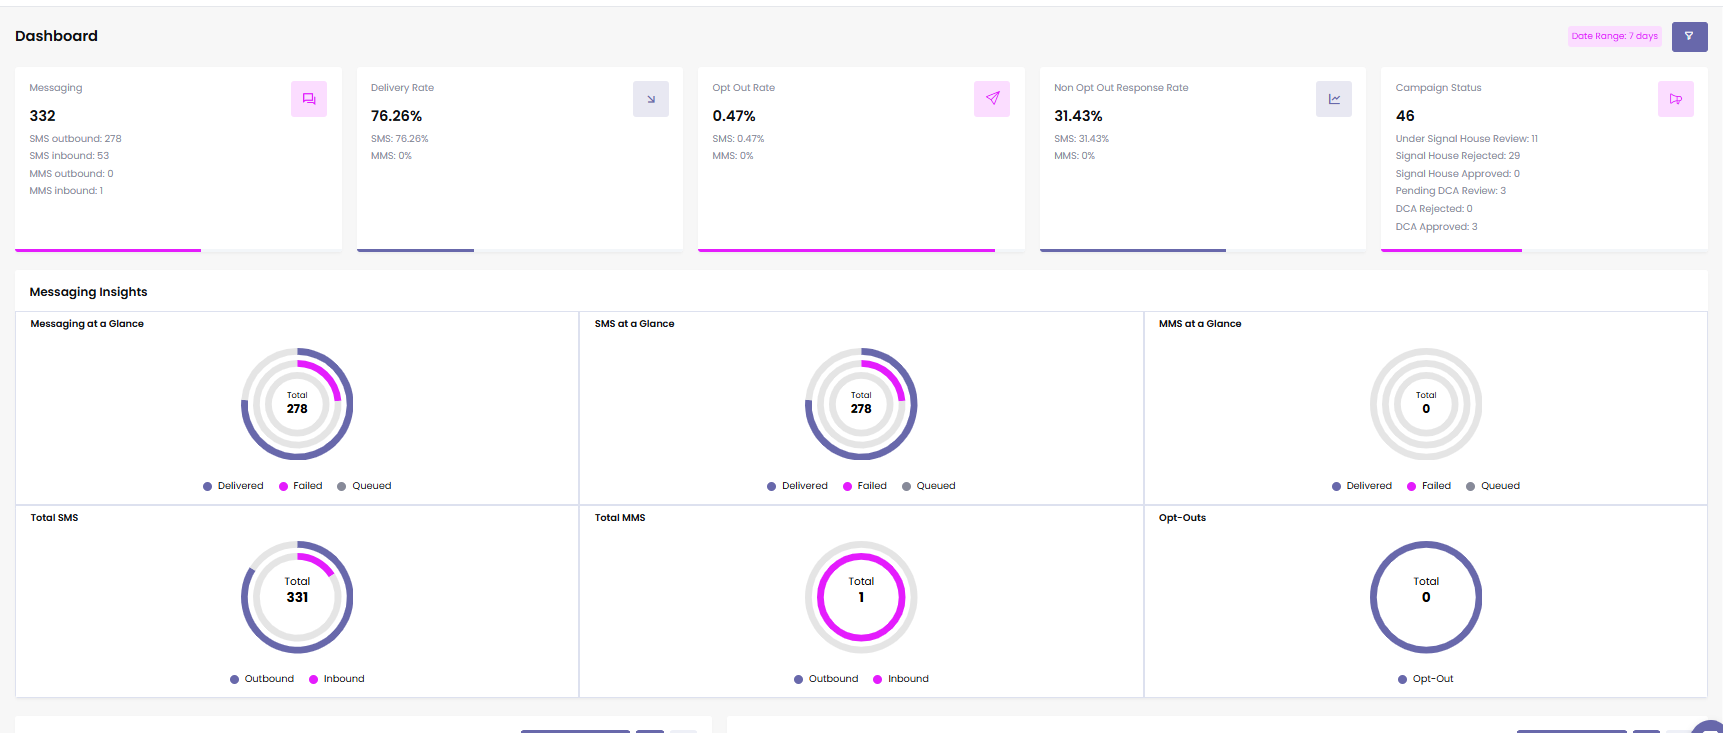
📊 Messaging Statistics
At the top of the dashboard, you’ll find:
SMS Sent (Outbound)
SMS Received (Inbound)
MMS Sent (Outbound)
MMS Received (Inbound)
These metrics offer a clear view of your messaging volume and direction.
🚚 Delivery Rate
Track the success of message delivery with:
SMS Delivery Rate
MMS Delivery Rate
This helps you monitor carrier-level performance and troubleshoot issues.
➡️ Want to learn more about Delivery Rate? Check out these articles below 👇
How to Improve Message Deliverability? 👀
🚫 Opt-Out Rate
This shows how many users unsubscribed by replying with keywords like "STOP." It’s tracked separately for:
SMS
MMS
💬 Non-Opt-Out Response Rate
This metric tracks the percentage of replies received (excluding opt-out replies), helping measure real customer engagement.
📑 Campaign Status Tracker
This section helps you monitor campaign progress:
Submitted
Under Signal House Review
Rejected by Signal House
Pending DCA Review
Rejected by DCA
Approved by DCA
➡️ Submitting your campaign? Check out the article below for a quick step-by-step guide to make it smooth!
Campaign Submission 📝
➡️ Want a campaign that actually gets results? The guide below will point you in the right direction.
Which Campaign Should I Choose? 🤔
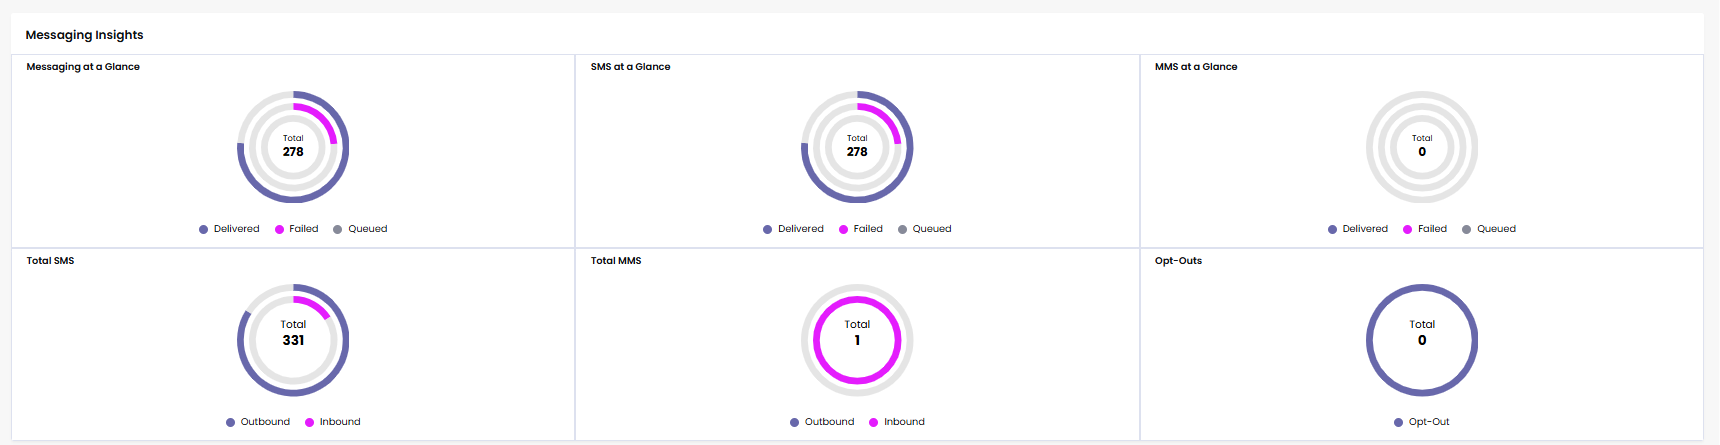
📈 Messaging Insights
Here you’ll see:
Number of Delivered, Failed, and Queued messages
Individual “At-a-Glance” stats for SMS and MMS
Totals for Inbound and Outbound messages
Total number of Opt-Outs
➡️ Curious to understand your insights better? Dive into the article below for a quick breakdown!
Analytics Tab Guide 📈
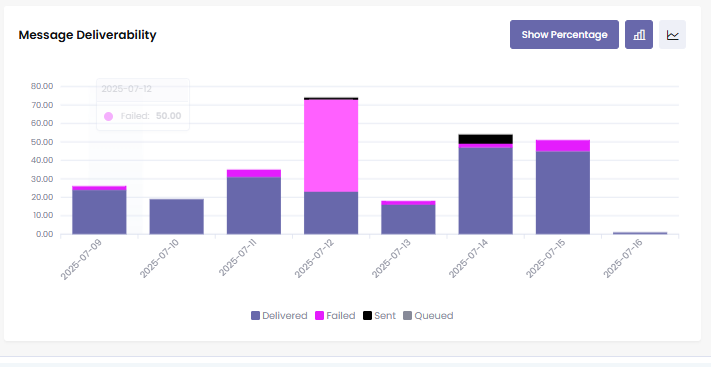
📉 Message Deliverability Timeline
Visualize delivery trends over time with:
A Bar Chart or Line Graph
Stats like Delivered, Failed, and Queued messages by day
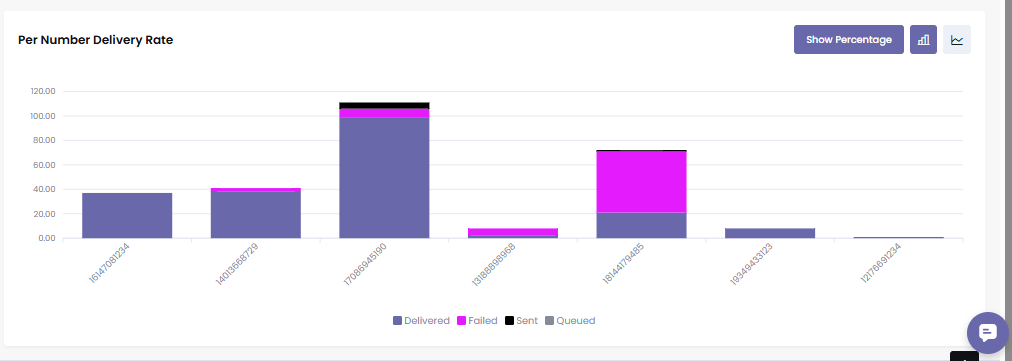
☎️ Per Number Deliverability
Dive deeper into message performance per phone number:
Identify underperforming numbers
Compare results using bar or line graphs
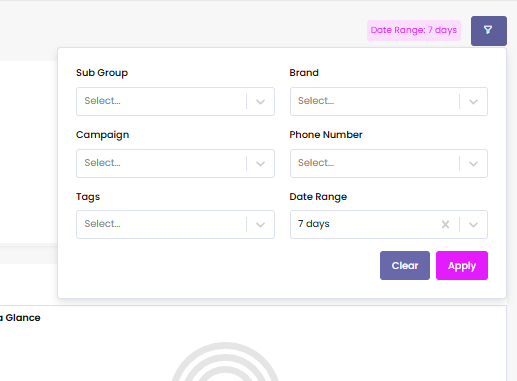
🧠 Smart Filters
The dashboard supports detailed filtering:
By Subaccount
By Brand
By Campaign
By Phone Number
By Time Range (Last 24h, 7d, 30d, or 120d)
This allows targeted performance checks across your Signal House ecosystem.
🎯 Why This Matters
The Agency View isn’t just for show — it’s your command center. Use it to:
Stay compliant
Spot failing campaigns or delivery issues early
Forecast throughput needs
Maintain control of high-volume messaging operations
💬 Need Help?
Here’s a quick Loom to walk you through everything—how to navigate each section, apply filters, and understand your analytics at a glance.
https://www.loom.com/share/f7f010b1a62b41d5bd054400a8bf3f64
Still have questions? We’ve got answers.
Reach our Support Team.