
Analytics Tab Guide
The Analytics Tab in the Signal House GHL App provides powerful, real-time insights into your messaging performance. It’s designed to give agencies complete visibility across all subaccounts, campaigns, and carriers, helping you measure efficiency and optimize results.
🔍 Overview of the Analytics Dashboard
When you open the Analytics Tab, you'll see four key filters at the top:
SMS, MMS, Outbound, Inbound
By default, all are selected, showing you the full picture. You can toggle them ON/OFF to view only the relevant data subset (e.g., only inbound MMS or outbound SMS).
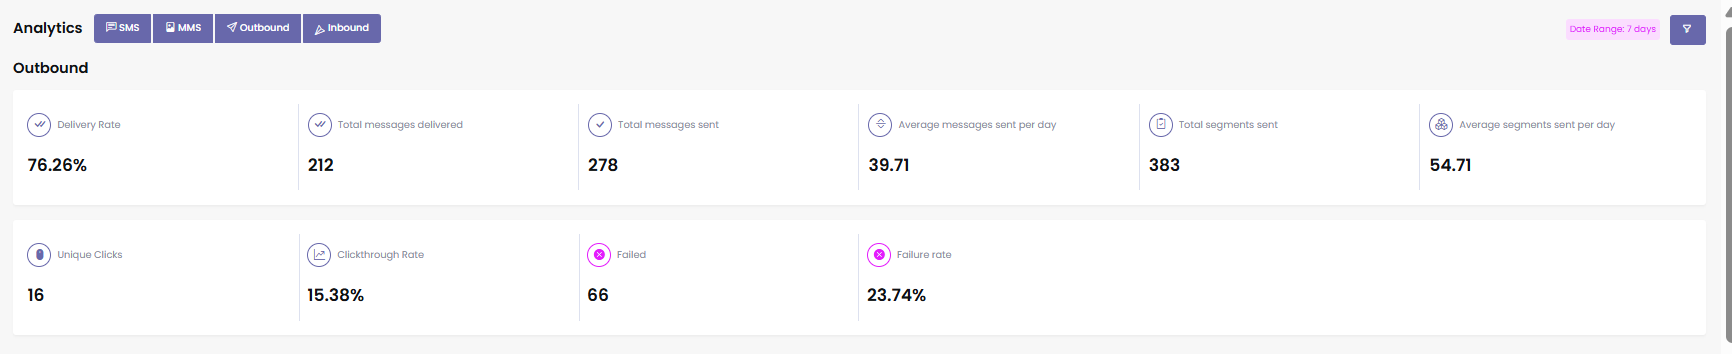
📤 Outbound Metrics
This section covers the performance of messages sent from your numbers:
Total Messages Delivered
Total Messages Sent
Average Messages Sent Per Day
Total Segments Sent
Average Segments Sent Per Day
Unique Clicks on Links
Clickthrough Rate (CTR)
Failed Messages
Failure Rate
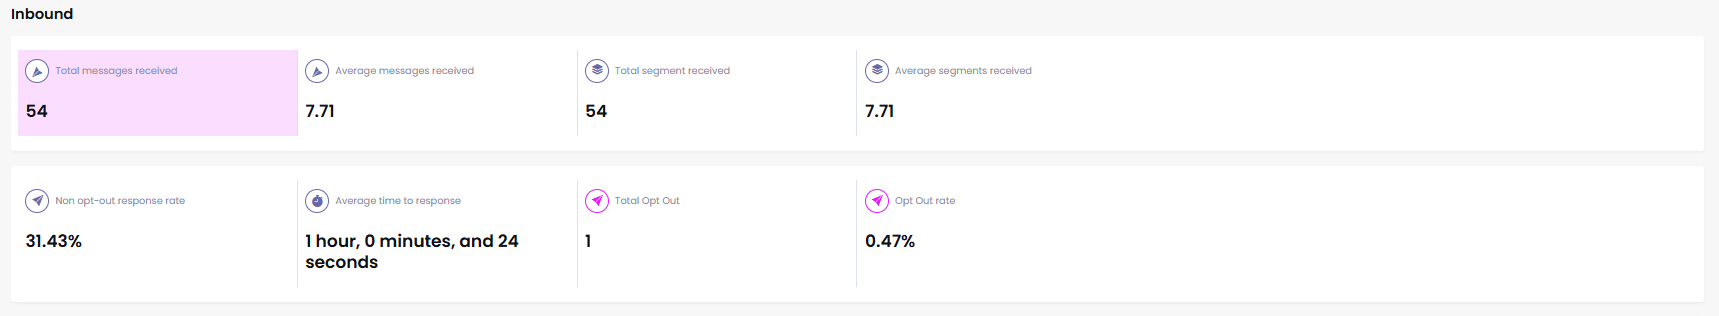
📥 Inbound Metrics
This section shows the data for messages received:
Total Messages Received
Average Messages Received Per Day
Total Segments Received
Average Segments Received Per Day
Non-Opt-Out Response Rate – percentage of replies excluding opt-out messages
Average Response Time
Total Opt-Outs
Opt-Out Rate
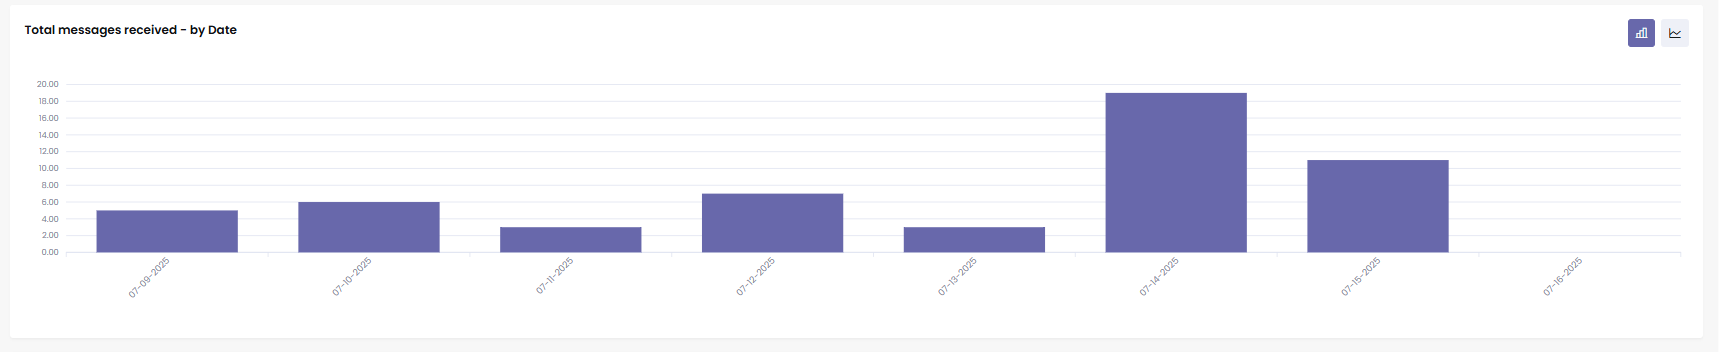
📅 Deliverability Trends & Visuals
Visual graphs are provided for message performance trends:
1. Deliverability by Date
Bar/line chart displaying:
Delivered messages
Failed messages
Sent messages
Queued messages
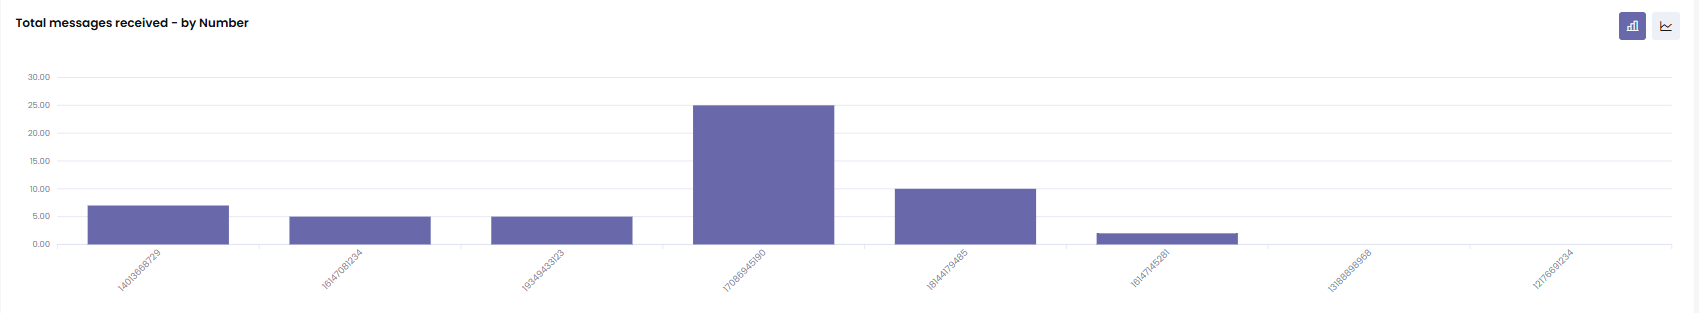
2. Deliverability by Number
Shows how each phone number is performing individually.
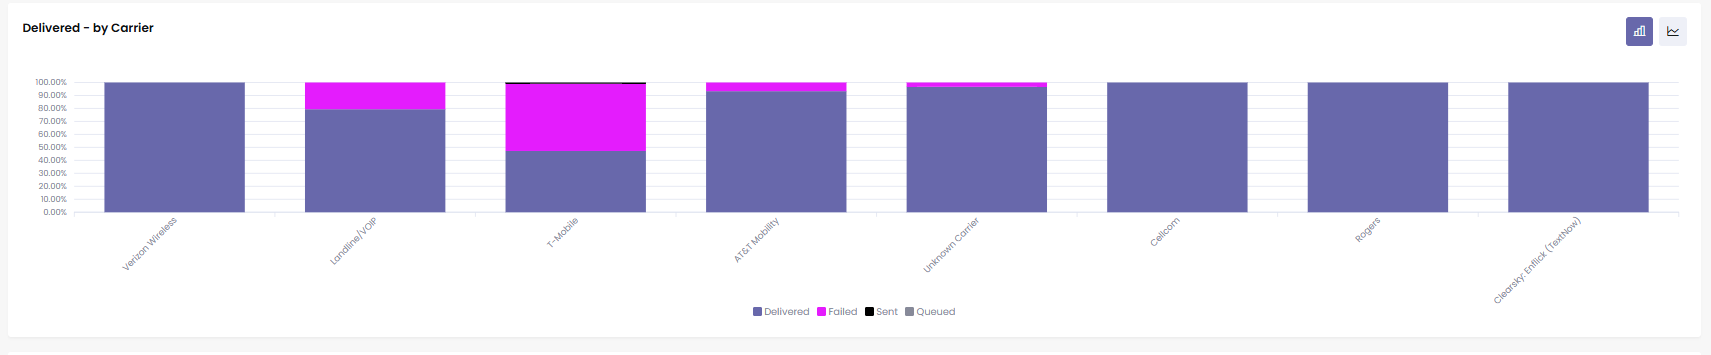
3. Deliverability by Carrier
Breaks down stats across major carriers (e.g., T-Mobile, AT&T, Verizon):
Delivered
Sent
Failed
Bar and line graphs available.
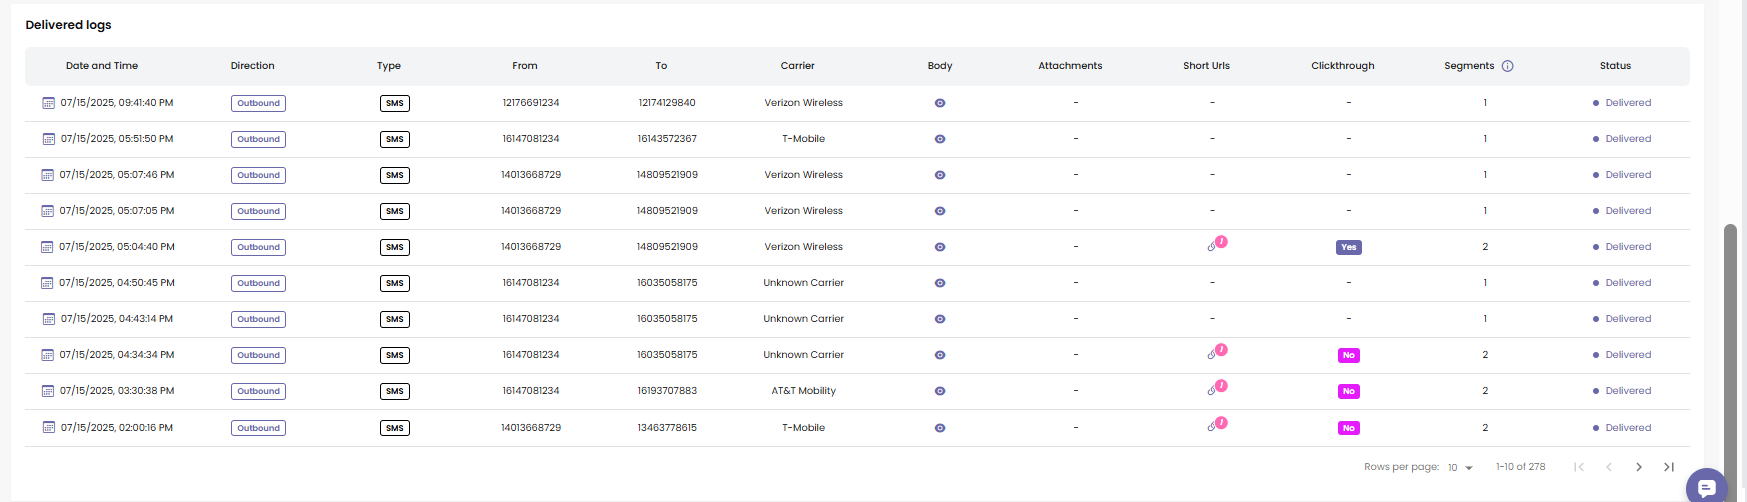
📜 Message Logs
Detailed logs of every message:
Date & Time
Direction (Inbound/Outbound)
Type (SMS/MMS)
From/To Numbers
Carrier
Message Content (via Eye icon)
Attachments
Short URL Tracking
Click Status (Yes/No)
Segment Count
Delivery Status
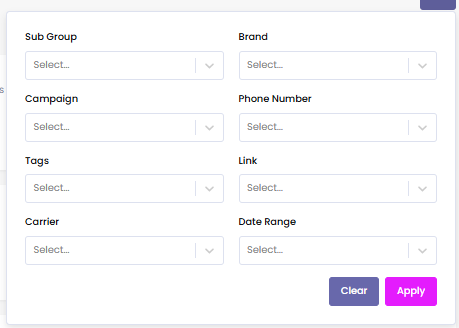
🎯 Smart Filters
Use filters for precise data insights:
Subaccount
Brand
Campaign
Phone Number
Tags
Links
Carrier
You can combine these filters with a dynamic date range:
24 Hours
7 Days
30 Days
120 Days
🎯 Why Use This?
The Analytics Tab isn’t just a metrics board. It gives you:
Full operational visibility
Carrier-wise message success
Real-time opt-out tracking
Performance by subaccount or brand
Instant feedback to optimize campaigns and reduce failures
It’s the heartbeat of your messaging efforts — giving you accountability, clarity, and control across your entire Signal House messaging ecosystem.